- Facts and Figures
- Social Security Statistics
- Social Media Statistics
- Cell Phone Usage Statistics
- Cryptocurrency Statistics
- White Collar Crime Statistics
- Crowdfunding Statistics
- Branding Statistics
- How Many Emails Are Sent Per Day
- Money Laundering Statistics
- Childcare Availability Statistics
- Cold Calling Statistics
- Automation And Job Loss Statistics
- Student Loan Statistics
- Spam Statistics
- Password Statistics
- Ransomware Statistics
- Christmas Spending Statistics
- Average Grocery Cost By State
- Average Screen Time Statistics
- Average Monthly Expenses
- IoT Statistics
- Gen Z Statistics
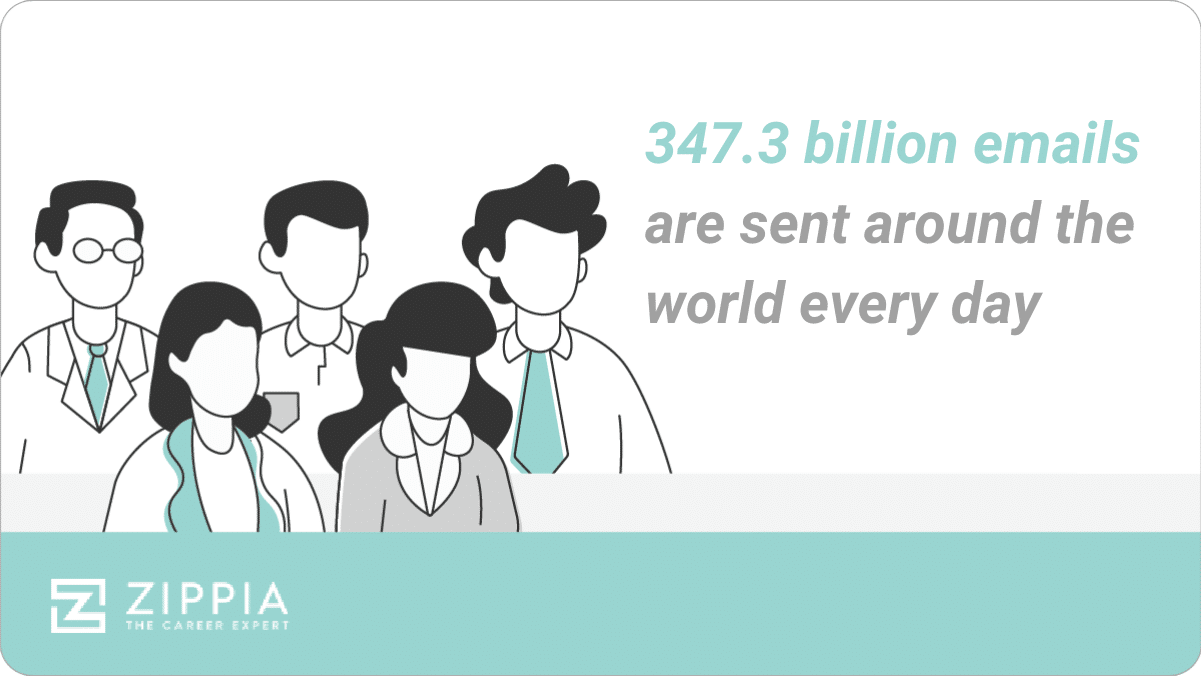
Research summary. Between companies and individuals, we send and receive about 347.3 billion emails every day, 61.9% of which we open on mobile devices. Because of email’s extensive use, it’s a top choice among marketers to produce income.
After extensive research, our data analysis team concluded:
-
347.3 billion emails are sent every day around the globe in 2023.
-
61.9% of all emails are opened on mobile devices, a 47% increase from 2019.
-
The average email open rate is 18%, although this can vary by as much as 1%, depending on the day of the week.
-
Most B2B and B2C marketers use email as an effective tool for nurturing leads and generating revenue.
-
The average email contains 434.48 words.
-
Email marketing delivers an average return on investment (ROI) of 4,200%.
-
4 out of 5 marketers would rather give up social media than email.
For further analysis, we broke down the data in the following ways:
Mobile | Open, Click, and Bounce | Multimedia | B2B and B2C | Formatting | Marketing
General Email Statistics
Billions of global emails are sent daily across multiple platforms, and the number is expected to grow. However, there’s a distinct divide between age groups and their daily email use.
-
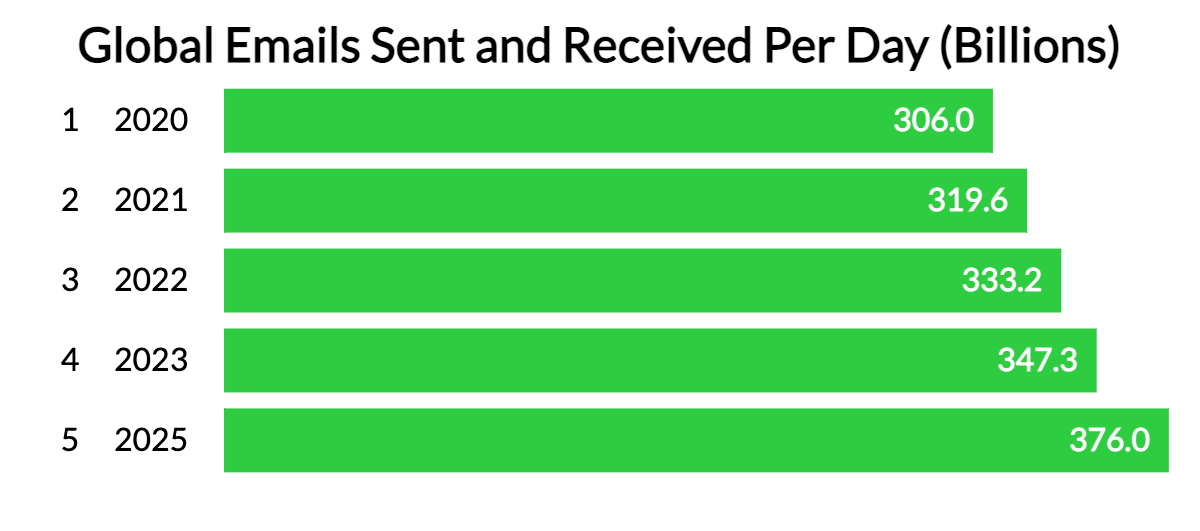
In 2023, businesses and consumers sent and received approximately 347.3 billion emails per day worldwide. This is projected to reach over 376 billion by 2025.
-
In 2019, over half of the world’s population (3.9 billion) used email, a number expected to grow to 4.3 billion by the end of 2023, 4.48 billion by 2024, and 4.6 billion by 2025.
-
Apple iPhone boasts the highest share of the email client market (29% of opens), followed by Gmail (27%), Apple Mail, Outlook, and Yahoo Mail.
-
89.4% of men use email, while the number (91.1%) is slightly higher for women.
-
Those born between 1981 and 1996 (Millennials) spend an average of 6.4 hours per day on email, which decreases to five hours per day for older demographics.
-
45% of internet users avoid opening emails from unknown email addresses.
| Share of U.S. email Users, by Ethnicity | |
|---|---|
| Ethnicity | Percentage |
| White, non-Hispanic | 91.7% |
| African American | 88.3% |
| Hispanic | 85.4% |
| Asian American | 92.1% |
| American Indian or Alaska Native | 83.5% |
| Other, non-Hispanic | 91.8% |
Mobile Email Statistics
For years, nearly half of all internet users have opened emails on their mobile devices, although the exact number varies significantly by age. What’s more, opening an email on a mobile device often translates into better engagement.
-
Mobile devices currently account for approximately half of the web traffic worldwide and have been so since early 2017.
-
Mobile accounted for 61.9% of all email opens in 2023.
-
40% of people 18 years old and under always open emails on their mobile device first.
-
Almost 25% of those who open an email on a mobile device will do so again: 70% will reopen on their mobile device, and 30% will use a desktop device. Furthermore, mobile readers who do this are 65% more likely to click through.
-
66% of emails opened on mobile devices are read for more than eight seconds.
-
Mobile-friendly email is the second most-used tactic email marketers use to boost performance.
-
Nearly one in five email campaigns aren’t optimized for mobile devices.
Email Open, Click, and Bounce Rate Statistics
Email open, click, and bounce rates can vary significantly depending on the time of day, the industry, the type of email (e.g., welcome versus promotional), subject lines, and whether emails contain embedded graphics or videos.
-
Globally, the average email open rate is 18%.
-
In the U.S., 21% of email opens happen between 9 am and noon.
-
Email campaigns sent at 4 am have an open rate of 24.31%, followed by 9 am (20.22%) and 11 am (20%).
-
The average email deliverability for all email service providers is 79.6%.
-
Across all industries, email has an average open rate of 17.61%, with a click rate of 8.74% and a bounce rate of 10.64%.
-
The non-profit industry has the highest email open rate (30.85%), followed by restaurant and food (30.09%), real estate (28.37%), health care (26.88%), and arts and entertainment (25.97%).
-
The transportation services industry has the highest bounce rate (15.93%), followed by legal services (14.42%), real estate (13.17%), and personal care services (13.16%).
-
The average open rate for a welcome email is 82%.
-
The longer an email sits in a recipient’s inbox, the less likely it is they’ll open it. For example, 21.49% of emails are opened within the first hour, which drops significantly to 8.91% after one hour and 5.81% after two hours.
-
Emails with personalized subject lines generate 50% higher open rates.
-
Adding videos to your emails can increase click rates by 300%.
| Average Email Benchmarks by Day | |||||||
|---|---|---|---|---|---|---|---|
| Sunday | Monday | Tuesday | Wednesday | Thursday | Friday | Saturday | |
| Open rate | 18% | 18.3% | 18% | 18.1% | 17.9% | 18.9% | 17.3% |
| Click-through rate | 2.5% | 2.5% | 2.5% | 2.6% | 2.5% | 2.7% | 2.4% |
| Click-to-open rate | 13.9% | 13.7% | 13.5% | 14.5% | 14.1% | 14.5% | 14% |
| Unsubscribe rate | 0.1% | 0.1% | 0.1% | 0.1% | 0.1% | 0.1% | 0.1% |

Email Multimedia Statistics
For the most part, recipients prefer embedded images and/or videos in emails, which improves both open and click-through rates.
-
65% of recipients prefer emails that contain mostly images, whereas 35% prefer mostly text.
-
54% of email subscribers prefer emails with videos.
-
Using the word “video” increases open rates by 19%, CTR by 65%, and cuts the number of unsubscribes by 26%.
-
An initial email with an attached video increases the click-through rate to 96% (a 200-300% increase compared to plain-text emails).
-
Emails with graphics have more than a 6% better open rate (21.44% vs. 15.02%) than emails without images.

Business (B2B and B2C) Email Statistics
Whether business-to-business or business-to-consumer, most marketers consider email as an essential means through which they can communicate with customers, generate revenue, and distribute content.
-
Nearly ¾ of customers prefer email as their primary channel for business communication.
-
87% of B2B marketers use email as a distribution channel, and 59% say it’s their most effective channel for generating revenue.
-
79% of B2C marketers rely on email to spread their new articles or blog posts.
-
Nine out of every ten marketers use email marketing to distribute content organically.
-
31% of businesses use email newsletters to nurture leads.
-
Companies that A/B test every email see returns that are 37% higher than those brands that do not.
-
Emails with a single call to action increase click by 371% and sales by 1617%.
-
Emails with active discount codes have an eight times higher chance to make a sale than those without any discounts.
Email Formatting Statistics
When it comes to effective emailing, how you craft your message is equally as important as what you say. You’ll need to consider subject line details, body length, whether to embed images and videos and if you should include a signature.
-
The average email contains 434.48 words and takes approximately 3.3 minutes to read.
-
Subject lines have an average of 43.85 characters.
-
6.9% of subject lines include emojis.
-
76% have used emojis in professional digital communication.
-
Email subject lines with an emoji can increase open rates by 56% compared to text-only subject lines.
-
Email subject lines with emojis perform slightly better than those without (20.37% vs. 19.73%, respectively).
-
69% of email recipients will report an email as spam solely based on the subject line.
-
Email signatures with photos receive 32% more replies than emails without them.
-
An ideal email signature length is no more than seven lines.
-
75% include contact info;
-
60% add a phone number;
-
7% attach Twitter details;
-
3% attach Facebook;
-
2% attach LinkedIn.
-
-
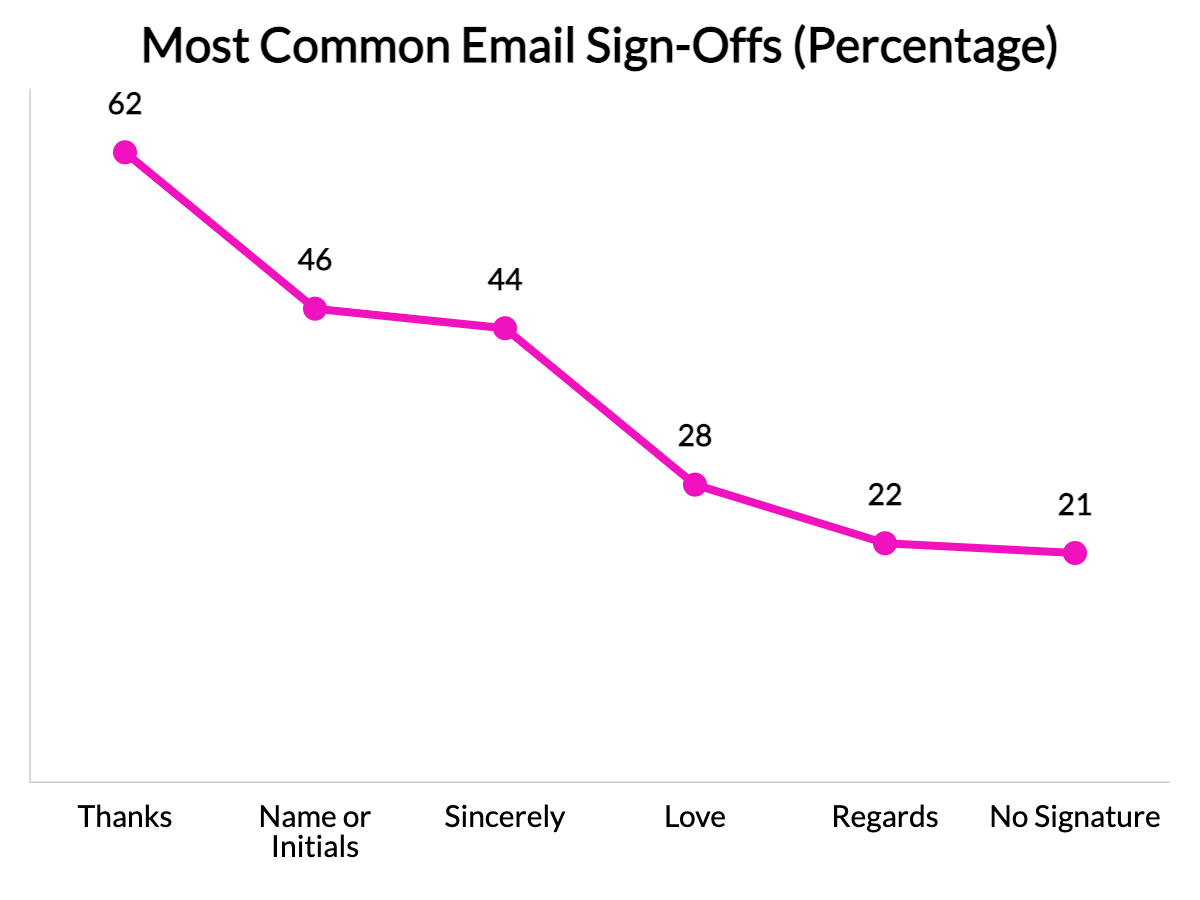
The most common email sign-offs are “Thanks” (62%), a name or initials (46%), “Sincerely” (44%), “Love” (28%), “Regards” (22%), and no signature at all (21%). **Respondents were allowed to select more than one answer.
-
17% of users say that emails are formal, 33% say they are informal, and 49% say it depends on the circumstances.
-
8% of all email campaigns fail to include an unsubscribe link.
-
Email subject lines that contain “video,” “fw,” “!,” and “now” have better open rates than those without.
Email Marketing Statistics
Email remains a popular and effective marketing channel — one that delivers the highest ROI. It’s also a valuable method for tracking content engagement.
-
Email marketing has the highest return on investment for small businesses.
-
For every $1 invested, email marketing delivers a $42 return.
-
29% of marketers rate email marketing as the most effective channel (25% for social media, 22% for SEO, and 25% for content marketing).
-
64.1% of small businesses use email marketing, while 59% of B2B companies do not.
-
78% of marketers consider email critical to their companies’ success, up from 71% in 2019.
-
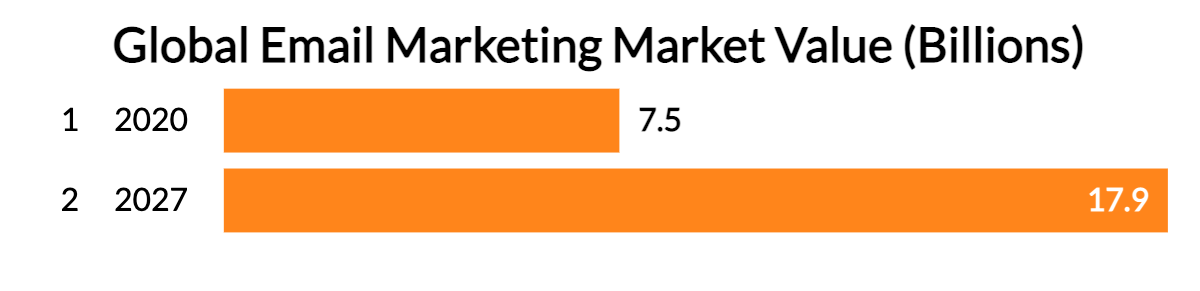
In 2020, the global email marketing market was valued at $7.5 billion, and it’s projected to increase to $17.9 billion by 2027.
-
On average, B2B companies send out one email marketing campaign every 25 days.
-
31% of B2B marketers say email newsletters are the best way to nurture leads.
-
Sending one email newsletter per week results in an average open rate of 30.09%, which is something 47.5% of marketers do.
-
35% of marketers choose to send three to five emails per week to their customers.
-
87% of B2B marketers say email is one of their top free organic distribution channels.
-
90% of B2B marketers track email engagement (e.g., opens, clicks, downloads) to measure content performance.
Email FAQ
-
How many global emails are sent per day?
Approximently 347.3 billion emails are sent globally each day. That’s an 4.2% increase from 2022 when 333.2 billion were sent each day.
Further, the number of emails sent per day will likely continue to increase, as projections say up to 376 billion emails will be sent per day in 2025 (a 12.8% increase).
-
Should you include emojis in your emails?
Whether or not you include emojis in your emails will depend on your audience. While 76% of people include emojis in their professional emails, many find them informal.
For example, a company that sells products to a young audience, mainly through advertising on YouTube and TikTok, may see a better ROI from using emojis. While on the other hand, a company that advertises political merchandise to older Americans might find that including emojis does more harm than good.
-
Millennials use email the most, at an average of 6.4 hours per day. Older generations use it for about five hours daily, whereas Gen Z prefers social media over email./p>
-
What are the average email open, click, and bounce rates?
The average email open rate is 17.61%, the click rate is 8.74%, and the bounce rate is 10.64%. However, factors like the time of day or week, as well as the industry sending the email, can all have a massive effect on these rates.
For example, email campaigns sent at 4 am have an open rate of 24.31% (38% more likely to be opened), and the non-profit industry has the highest email open rate of 30.85% (75% more likely to be opened).
-
What’s the average return on investment for email marketing?
The average return on investment for email marketing is 42:1. That means for every $1 invested into an email, it generates a $42 return.
Conclusion
Despite social media’s overwhelming online presence, email still holds out as one of the most valuable and essential marketing tools for any business. In fact, 4 out of 5 marketers would rather give up social media than email.
And that’s because email is still so incredibly profitable, with an average ROI of 4,200%. As of 2023, over 347 billion emails are sent around the world each day, and due to their marketing success, this number is only expected to increase to 376 billion by 2025.
So, far from being a relic of the past, email is still one of the most essential marketing tools for any business.
Sources
-
The Radicati Group. Email Statistics Report, 2019-2023. Accessed on 10/1/21.
-
Statista. Email marketing revenue worldwide from 2020 to 2027. Accessed on 10/1/21.
-
Statista. Number of email users worldwide from 2017 to 2025. Accessed on 10/1/21.
-
Campaign Monitor. Small Business Marketing in 2021: Trends to refine your marketing efforts. Accessed on 10/4/21.
-
Constant Contact. Average industry rates for email as of August 2021. Accessed on 10/4/21.
-
Hubspot. Email Marketing Strategy in 2020. Accessed on 10/4/21.
-
Content Marketing Institute. B2B Content Marketing 2020. Accessed on 10/4/21.
-
Campaign Monitor. Ultimate Email Marketing Benchmarks for 2021: By Industry and Day. Accessed on 10/4/21.
-
SuperOffice. New Study: 50% of B2B Companies Do Not Use Email Marketing. Accessed on 10/4/21.
-
Statista. Percentage of mobile device website traffic worldwide from 1st quarter 2015 to 1st quarter 2021. Accessed on 10/4/21.
-
Litmus Labs. Email Client Market Share. Accessed on 10/4/21.
-
Hubspot. The Ultimate List of Marketing Statistics for 2021. Accessed on 10/4/21.
-
GetResponse. Email Marketing Benchmarks. Accessed on 10/4/21.
-
Statista. Protective actions taken by internet users worldwide over the past year as of February 2019. Accessed on 10/4/21.
-
Statista. Number of sent and received emails per day worldwide from 2017 to 2025. Accessed on 10/4/21.
-
Statista. Percentage of internet users in the United States who use email as of November 2019, by gender. Accessed on 10/4/21.
-
Statista. Percentage of internet users in the United States who use email as of November 2019, by ethnicity. Accessed on 10/4/21.
-
Oberlo. 10 Email Marketing Statistics. Accessed on 10/4/21.
-
GetResponse. Email Marketing and Automation Excellence 2018. Accessed on 10/4/21.
-
Emma. 9 sizzling marketing stats from this summer. Accessed on 10/4/21.
-
Medium.com. The stats don’t lie: discounts and free shipping increase sales. Accessed on 10/4/21.
-
AWeber. 2019 Email Marketing Statistics: We Analyzed 1,000 Emails from Today’s Top Experts. Accessed on 10/4/21.
-
Uplers Email. Best Practices Of Email Signature Marketing. Accessed on 10/4/21.
-
Huffington Post. Is Your Email Sign-Off Annoying? You Might Just Want To Say ‘Thanks’. Accessed on 10/4/21.
-
Inc. 11 Emojis That Make You Look Really Unprofessional at Work. Accessed on 10/5/21.
-
Campaign Monitor. The Real Scoop on Email Emoji in Subject Lines. Accessed on 10/5/21.
-
Wordstream. 75 Staggering Video Marketing Statistics for 2021. Accessed on 10/5/21.
-
Kinsta. 20+ Must-Know Email Marketing Statistics. Accessed on 10/5/21.
- Facts and Figures
- Social Security Statistics
- Social Media Statistics
- Cell Phone Usage Statistics
- Cryptocurrency Statistics
- White Collar Crime Statistics
- Crowdfunding Statistics
- Branding Statistics
- How Many Emails Are Sent Per Day
- Money Laundering Statistics
- Childcare Availability Statistics
- Cold Calling Statistics
- Automation And Job Loss Statistics
- Student Loan Statistics
- Spam Statistics
- Password Statistics
- Ransomware Statistics
- Christmas Spending Statistics
- Average Grocery Cost By State
- Average Screen Time Statistics
- Average Monthly Expenses
- IoT Statistics
- Gen Z Statistics
Author
Chris Kolmar is a co-founder of Zippia and the editor-in-chief of the Zippia career advice blog. He has hired over 50 people in his career, been hired five times, and wants to help you land your next job. His research has been featured on the New York Times, Thrillist, VOX, The Atlantic, and a host of local news. More recently, he's been quoted on USA Today, BusinessInsider, and CNBC.